I get a lot of questions thrown my way about Eneza’s users and our data. We love data on the Eneza Team, mostly because we have so much of it. We think it’s important to share data because there are few comparisons in the African tech market. If you publish your data, you’re helping the whole ecosystem by allowing it to start using you as a baseline.
Let’s all get out of pitch mode and start a conversation about meaningful data. Tweet This Quote
Yes, you may be giving “the competition” more information about your company. However, the work we’re doing is so important and urgent, we would be doomed if we didn’t try to hurry the ecosystem along.
The more we grow as a company, the more I realize how nuanced our data is—making it even more important to share. For example, take the number of users. There are many different interpretations—users per month, per week, per day? Unique users? Active users? Don’t get me started on what constitutes as “active.”
For this post, I’m going to focus on what we consider our most meaningful data pulled from our databases and how we define that data. We have even more data from user experience tests and from the 1,000 or so calls we make to users every week that I won’t include just yet. This includes demographic data on gender, age, and location. I’ll explain more about this data and our “impact studies” in a future post.
If you publish your data, you’re helping the whole ecosystem by providing it with a baseline. Tweet This Quote
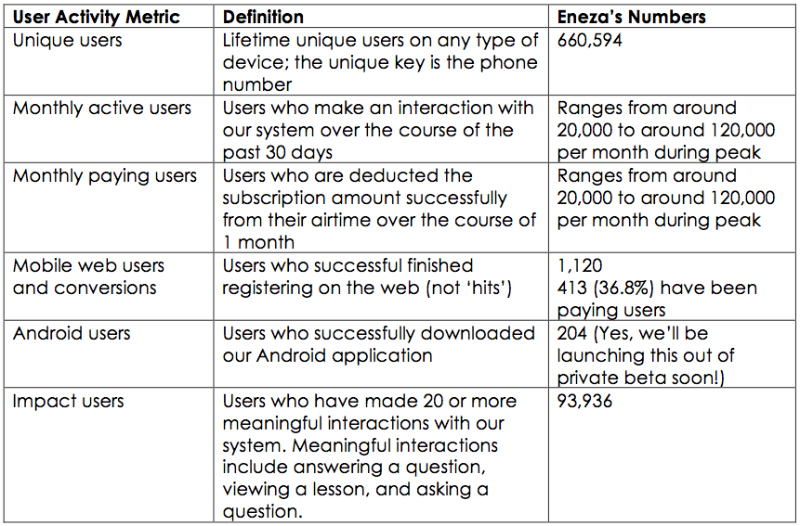
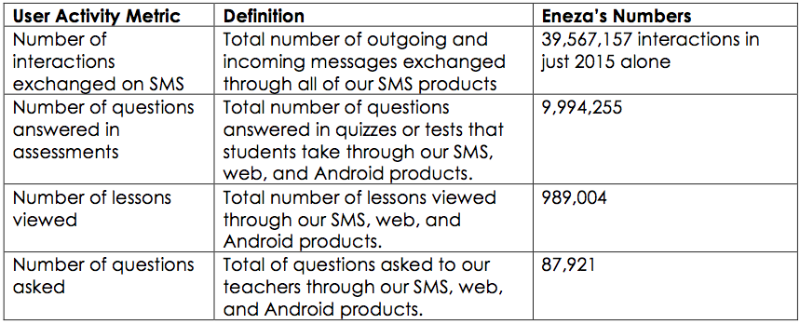
Now, I’d like to start a conversation about the data we’re formally tracking, why we find it meaningful, and what others are finding important to track in the African market. I’ve been impressed by reports, both formal and informal, published by Jumia and iROKO’s CEO, and I’d like to follow suit and show what data Eneza uses. Here’s a brief rundown of the metrics we think are most powerful to track with our users and current numbers, followed by what I think is important to know from our data:
Reach and Activity

Academic Data

1. Nearly 1 million learning hours have taken place through Eneza’s products. Our users tell us they usually read their Eneza mini-lesson in 5 minutes, and each question in an assessment takes about 5 minutes to answer (989,004 lessons x 5 minutes = 4,945,020 minutes; 9,994,255 questions answered x 5 minutes = 49,971,275 minutes). In addition, questions asked take about 15 minutes of time (87,921 questions asked x 15 minutes = 1,318,815 minutes). Add these minutes up, and you get 56,235,110 learning minutes. This equals 937,251 learning hours—nearly 1 million hours of learning so far on the Eneza platform. To give some context, let’s say it takes you 20 hours to finish a textbook. One million learning hours is like reading 50,000 textbooks.
The work we do is so important and urgent that if we don’t share data, we won’t move the ecosystem along. Tweet This Quote
2. Our monthly users are 18.2% of our total user base at seasonal peak. Not yet at Twitter levels, (24% of Twitter users are monthly) but we are pleased. Consistency in activity is incredibly important. This metric helps us know if our product is habit forming and if people are making this a part of their every day lives. For introducing tech products into a new market, demonstrating behavior change is critical.
3. 14% of our users are impact users, interacting with us 20 times or more. This comfortably puts us above average on the 70-20-10 rule, which observes that on most media and digital services, only 10% of the users are highly active, with the rest “lurking” or just passively following. It’s challenging to “lurk” on SMS, so it’s a bit more binary for us on this product. This post provides another take on this idea.
For introducing tech products into a new market, demonstrating behavior change is critical. Tweet This Quote
4. More than one-third of our web/Android users have paid, although we haven’t begun actively marketing our web/Android products. Thus, there is a great demand. We’re excited to be entering the online mobile world, especially after reading the blogs I mentioned above.
5. Customers and consumers are willing to pay for EdTech products, whether it’s on SMS or mobile web/Android. The thing that is holding people back the most is the ability to pay through a seamless mechanism. More on this in a future post as well.
I’d love to know from other tech entrepreneurs and CEOs in the African market—what do you track? What do you find most important to look at? Let’s all get out of pitch mode and start a conversation about meaningful data.
The data presented in this post was current as of January 29, 2016.


